Georgia Tech Patagonia VIP
Don't get too excited this is not my latest travel post. This is about one of my semesters at Georgia Tech in the VIP program. VIP stands for Vertically Integrated Projects, which focuses on collaborative research, vertically (levels), and interdisciplinary (schools). Students get the chance to work on a research project under the supervision of an advisor(s) along with other students from many different backgrounds and academic levels.
There are many different VIP teams that I could join. At the time of this writing, there are 85. I decided to work on the Patagonia Team; their goal was to ensure sustainability for the park, given the expected increase in tourism. This mission is something I deeply care about, and I wanted to see if there was a way that I could help as a computer science student. I was part of this program in the Spring 2021 semester.
Inside this program, there were many different teams. Some focused on economics, diversity, ecotourism, and many others. Some of these subteams had been working on this program for years. I joined and felt I had much to learn. I was also the only computer science student in the Patagonia VIP program. We got to pick our teams through a selective process; I was lucky enough to get my first pick and ended up on the Land Use Team.
I found out that historically the land use team had spent several semesters gathering data on endangered species and compiling the data. This was difficult as Patagonia is a remote wilderness, so there was a general lack of data.
As a team, we brainstormed ideas to progress the project for the rest of the semester. They had used some GIS tools in the past, but they are only powerful if you have data. Then I started to research how to use imagery data to classify land types. We could then use this classified map to tie back to species, and other land uses. Lo and behold! The intersection of computer science and environmental science.
I spent the next few weeks looking into ways to do this. At that point, I had never worked with GIS or imagery data. As the only CS and graduate student on the team, I felt the pressure to figure this out. We looked into several tools from Google but ultimately decided to use a combination of QGIS and Microsoft AI for Good Landcover tool.
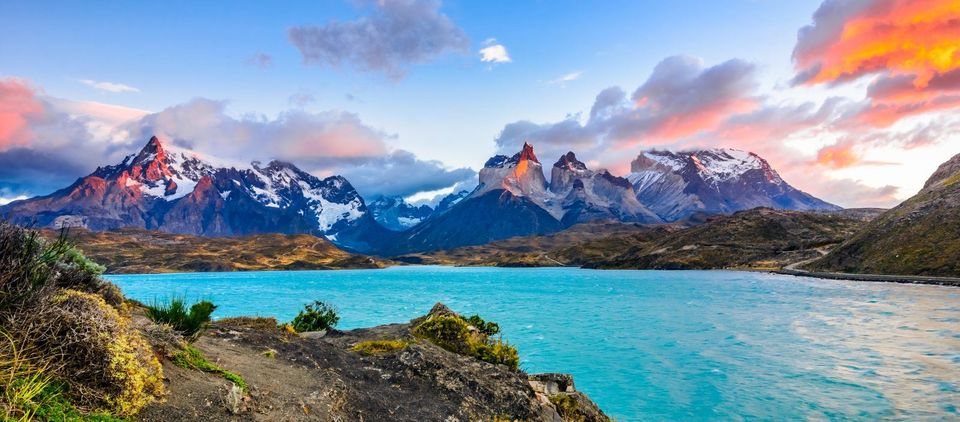
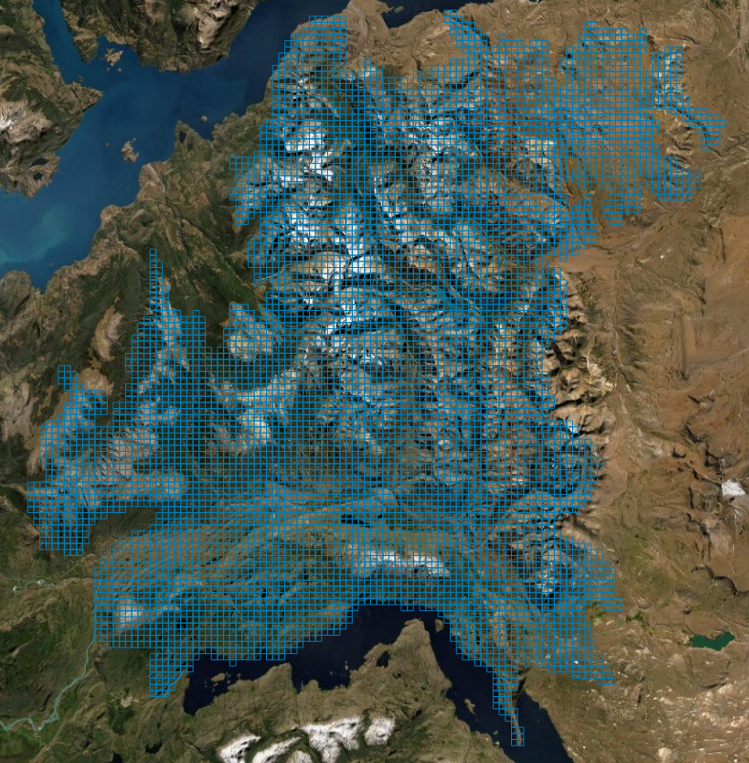
The first issue was getting a map and identifying a region of interest. Historically the team had only worked on a smaller area of the park surrounding Lake Jeinemeni. This area was our primary objective, but if we could scale this to work for the whole park, that would be much more useful for future research.
We used ESRI data as it was readily available. Looking back, I should have leveraged my student access with planet.com, as they have great data sources.
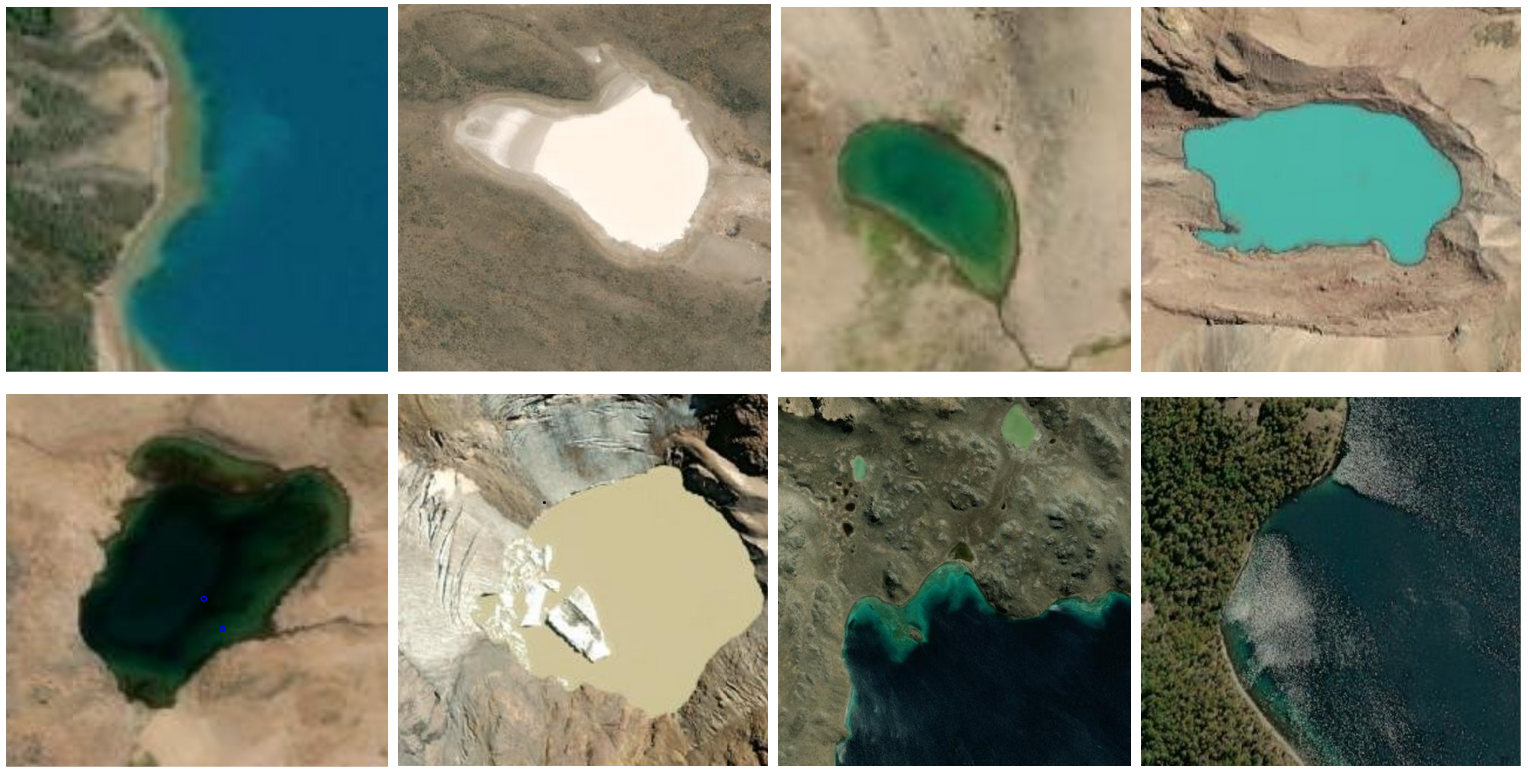
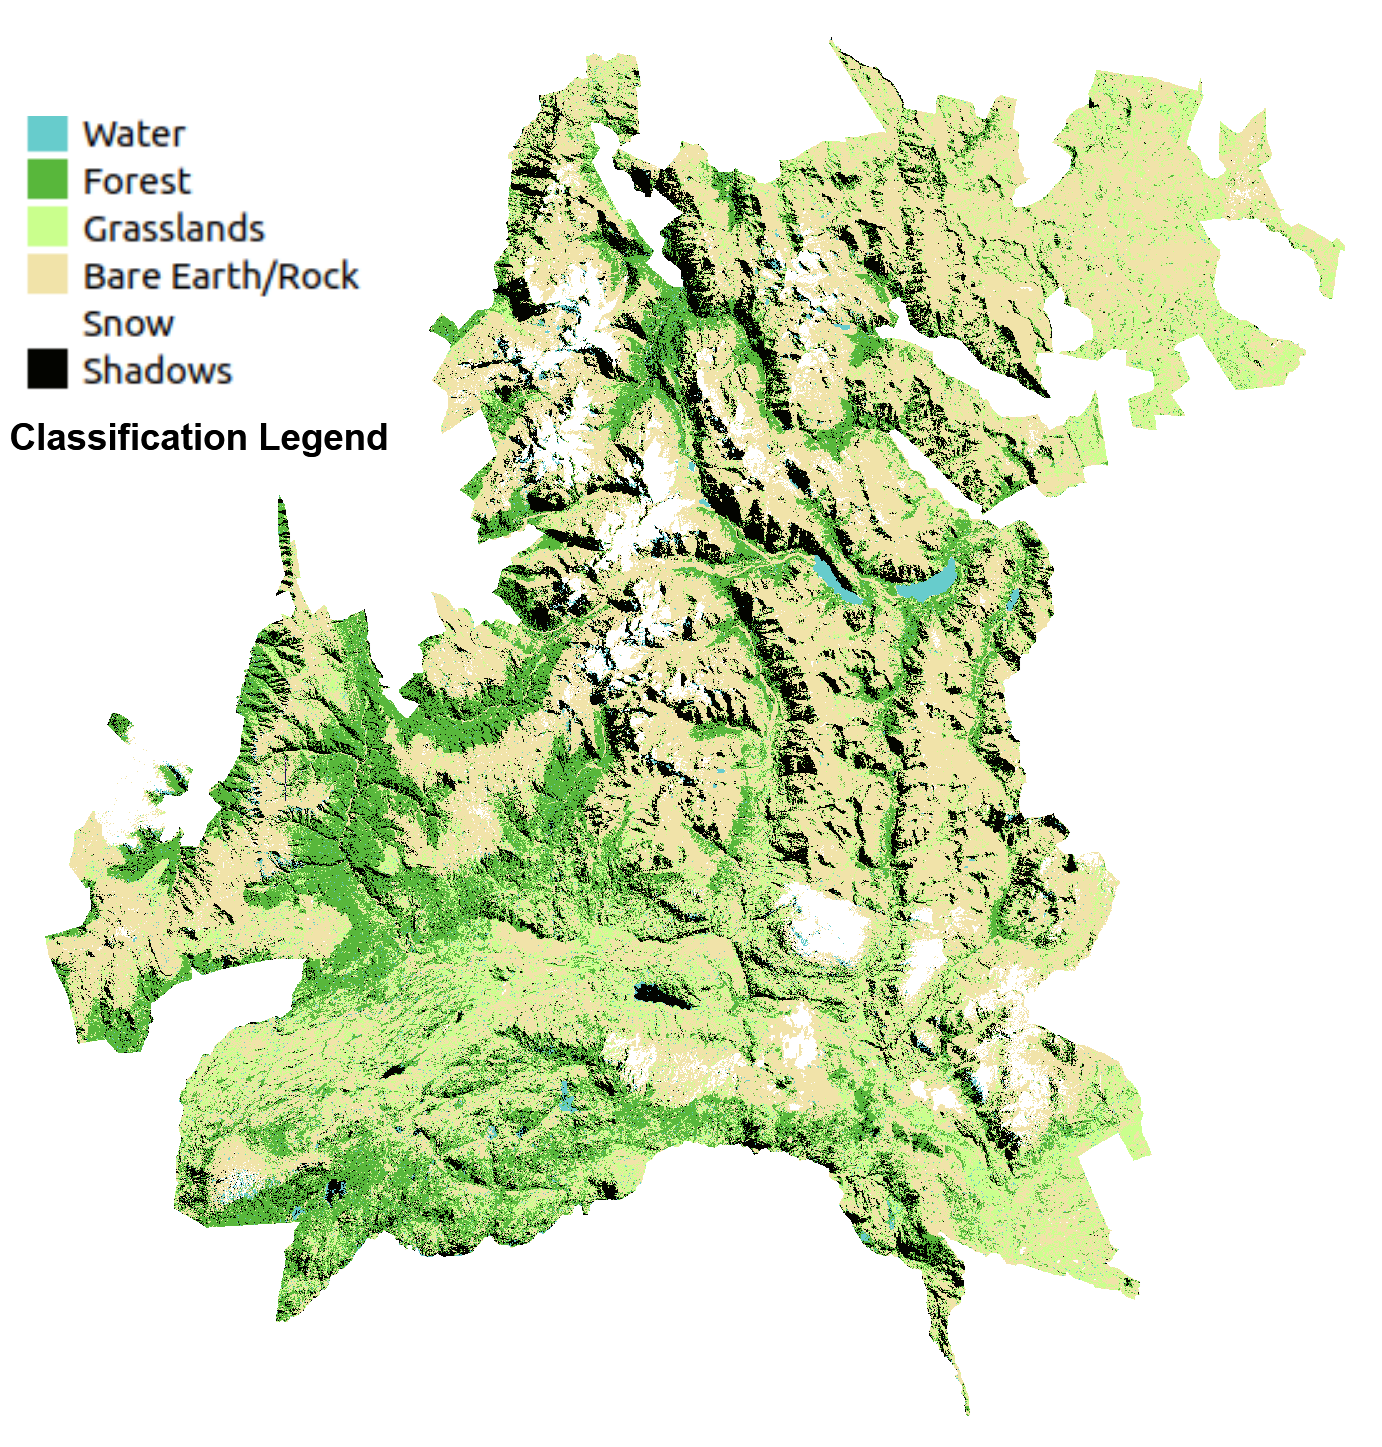
The second step was to identify the land types we wanted to identify. From the imagery data, just by visually examining the imagery, we could identify; Water, Forest, Grasslands, Rock/Earth, Snow. There were areas that were too dark from shadows to identify and were labeled as shadows. These classifications were simplified because, at the time, I was most familiar with basic machine learning techniques like random forests. To identify rock vs. earth, more machine learning algorithms live convolutional neural networks need to be used. Some harder classification examples are below.
I had many problems getting to the tool to run. It is set up to run like a server and had a configuration error for the loopback address. Apparently, It was really only intended to run on a remote server. I also found that after classifying a map and exporting it, the coordinate system was not being written to the tiff! Being so new to GIS and the Landcover Tool I originally thought I was doing something wrong. I opened an issue on Github and the lead developer fixed it right away. We had a video call later and he was immensely helpful.
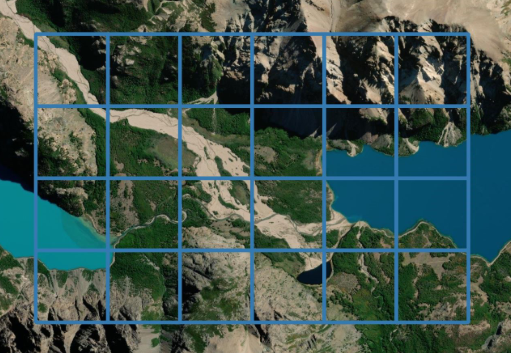
At this point, I thought I had a working solution for our problem. I then found out the tool was only designed to classify small areas, around one sq km. This would not do; my idea was to then use the Landcover Tool for the classifier's training and then perform the inference outside of the landcover tool. I created a grid of the park and then performed the inference on each cell.
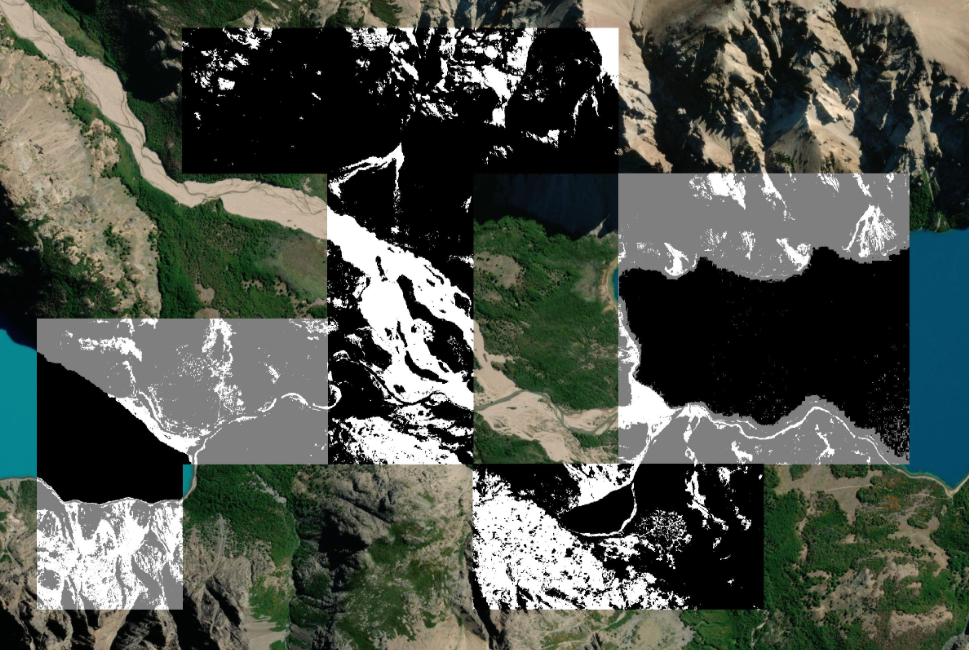
So that the rest of my team could have a hands-on experience, I spun up an instance of the tool on Microsoft Azure. With this, the rest of the team could use the browser on their machine and go into label data. With the team training of the classifier, I was then ready to perform inference on the cells. Once the cells were stitched together and colorized, viola, we had our final map!
Looking back, this was an enjoyable project. I learned so many things, and I had to figure things out as I went. Now, this map can be used for evaluating all sorts of different land uses for the Patagonia Team. Thanks to: my team, my advisors, Dr. Paula Gomez, Kevin Caravati, and Caleb Robinson at Microsoft AI for Good.

Comments ()